The Cyprus House Price Index (HPI) rose by 5.3 per cent on an annual basis in the third quarter of 2022 according to preliminary figures in a press release issued by the island’s Statistical Service (CYSTAT).
The HPI also rose by 5.8 per cent in the third quarter of 2022 compared to the previous quarter.
The base year for the HPI is 2015=100 and the Index now stands at 112.51.
According to the CYSTAT, the Cyprus House Price Index (HPI) “is a quarterly index which measures the change in the average prices of residential dwellings. It captures all types of residential properties, both new and existing. The land component of the residential property is included.
“The data source used for both, indices and weights, is the Department of Lands and Surveys, Ministry of Interior. The data cover all areas which are under the control of the government of the Republic of Cyprus.
“Data are marked as provisional and are revised as soon as new information is available.”
| Year | Quarter | House Price Index (2015=100) |
Quarterly Change (Compared to the previous quarter) (%) |
Annual Change (Compared to the same quarter of the previous year) (%) |
|---|---|---|---|---|
| 2010 | Q1 | 114.37 | -1.6 | -6.6 |
| Q2 | 112.79 | -1.4 | -6.9 | |
| Q3 | 112.39 | -0.4 | -5.7 | |
| Q4 | 112.05 | -0.3 | -3.6 | |
| 2011 | Q1 | 111.56 | -0.4 | -2.5 |
| Q2 | 113.99 | 2.2 | 1.1 | |
| Q3 | 111.22 | -2.4 | -1.0 | |
| Q4 | 107.60 | -3.2 | -4.0 | |
| 2012 | Q1 | 106.40 | -1.1 | -4.6 |
| Q2 | 106.02 | -0.4 | -7.0 | |
| Q3 | 110.14 | 3.9 | -1.0 | |
| Q4 | 108.22 | -1.7 | 0.6 | |
| 2013 | Q1 | 104.54 | -3.4 | -1.7 |
| Q2 | 104.77 | 0.2 | -1.2 | |
| Q3 | 103.05 | -4.7 | -9.3 | |
| Q4 | 100.78 | 0.9 | -6.9 | |
| 2014 | Q1 | 98.08 | -2.7 | -6.2 |
| Q2 | 103.55 | 5.6 | -1.2 | |
| Q3 | 102.70 | -0.8 | 2.8 | |
| Q4 | 101.56 | -1.1 | 0.8 | |
| 2015 | Q1 | 97.52b | ||
| Q2 | 100.59 | 3.1 | ||
| Q3 | 102.49 | 1.9 | ||
| Q4 | 99.40 | -3.0 | ||
| 2016 | Q1 | 97.29 | -2.1 | -0.2 |
| Q2 | 99.18 | 1.9 | -1.4 | |
| Q3 | 101.87 | 2.7 | -0.6 | |
| Q4 | 102.72 | 0.8 | 3.3 | |
| 2017 | Q1 | 99.64 | -3.0 | 2.4 |
| Q2 | 102.74 | 3.1 | 3.6 | |
| Q3 | 102.46 | -0.3 | 0.6 | |
| Q4 | 105.24 | 2.7 | 2.4 | |
| 2018 | Q1 | 103.10 | -2.0 | 3.5 |
| Q2 | 104.01 | 0.9 | 1.2 | |
| Q3 | 103.12 | -0.9 | 0.6 | |
| Q4 | 107.04 | 3.8 | 1.7 | |
| 2019 | Q1 | 107.93 | 0.8 | 4.7 |
| Q2 | 112.73 | 4.5 | 8.4 | |
| Q3 | 105.64 | -6.3 | 2.4 | |
| Q4 | 106.51 | 0.8 | -0.5 | |
| 2020 | Q1 | 109.13 | 2.5 | 1.1 |
| Q2 | 109.48 | 0.3 | -2.9 | |
| Q3 | 104.21 | -4.8 | -1.3 | |
| Q4 | 109.10 | 4.7 | 2.4 | |
| 2021 | Q1 | 102.82 | -5.8 | -5.8 |
| Q2 | 104.07 | 1.2 | -4.9 | |
| Q3 | 106.55 | 2.4 | 2.2 | |
| Q4 | 103.28 | -3.1 | -5.3 | |
| 2022 | Q1 | 103.95 | 0.5 | 1.1 |
| Q2 | 106.35 | 2.3 | 2.0 | |
| Q3 | 112.51 | 5.8 | 5.3 |
b There is a break in the series in the first quarter of 2015 due to redefinition of the model variables.
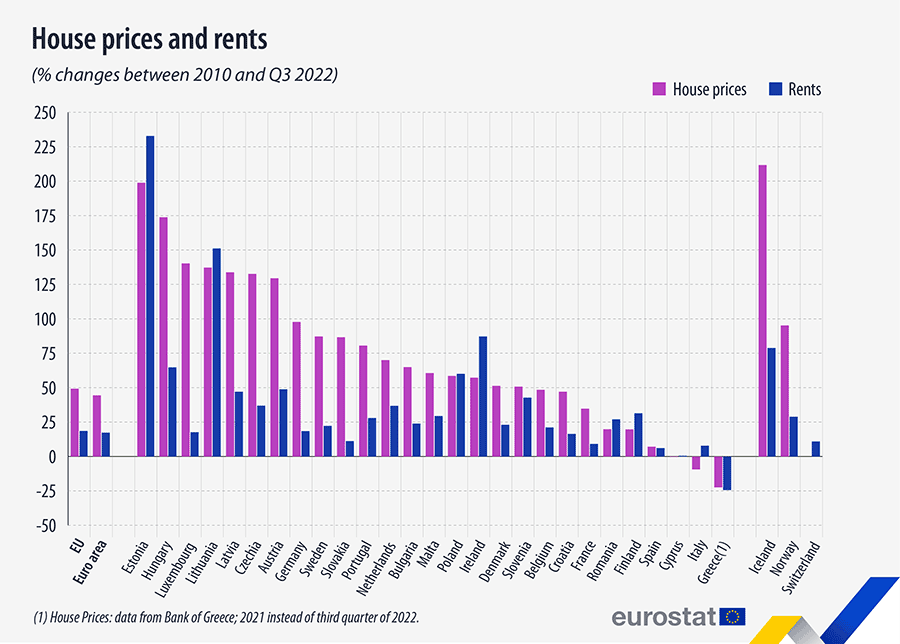
House prices in Europe
Meanwhile, Eurostat reports that house prices increase by 49% between 2010 and the third quarter of 2022, with house prices increasing in 24 EU Member States and falling in three.
They more than doubled in Estonia (+199%), Hungary (+174%), Luxembourg (+140%), Lithuania (+137%), Latvia (+134%), Czechia (+133%) and Austria (+130%).
Decreases were observed in Greece (-22%), Italy (-9%) and Cyprus (-0.3%).
Rents in Europe
When comparing the third quarter of 2022 with 2010 for rents, prices increased in 26 EU Member States and decreased in one, with the highest rises in Estonia (+233%) and Lithuania (+151%). Decreases were recorded in Greece (-24%).